
Most businesses are sitting on more data than ever, and somehow fewer straight answers. The numbers exist, but getting to a decision still means days of digging and an argument over whose figures to believe. Here's how BI fixes that.
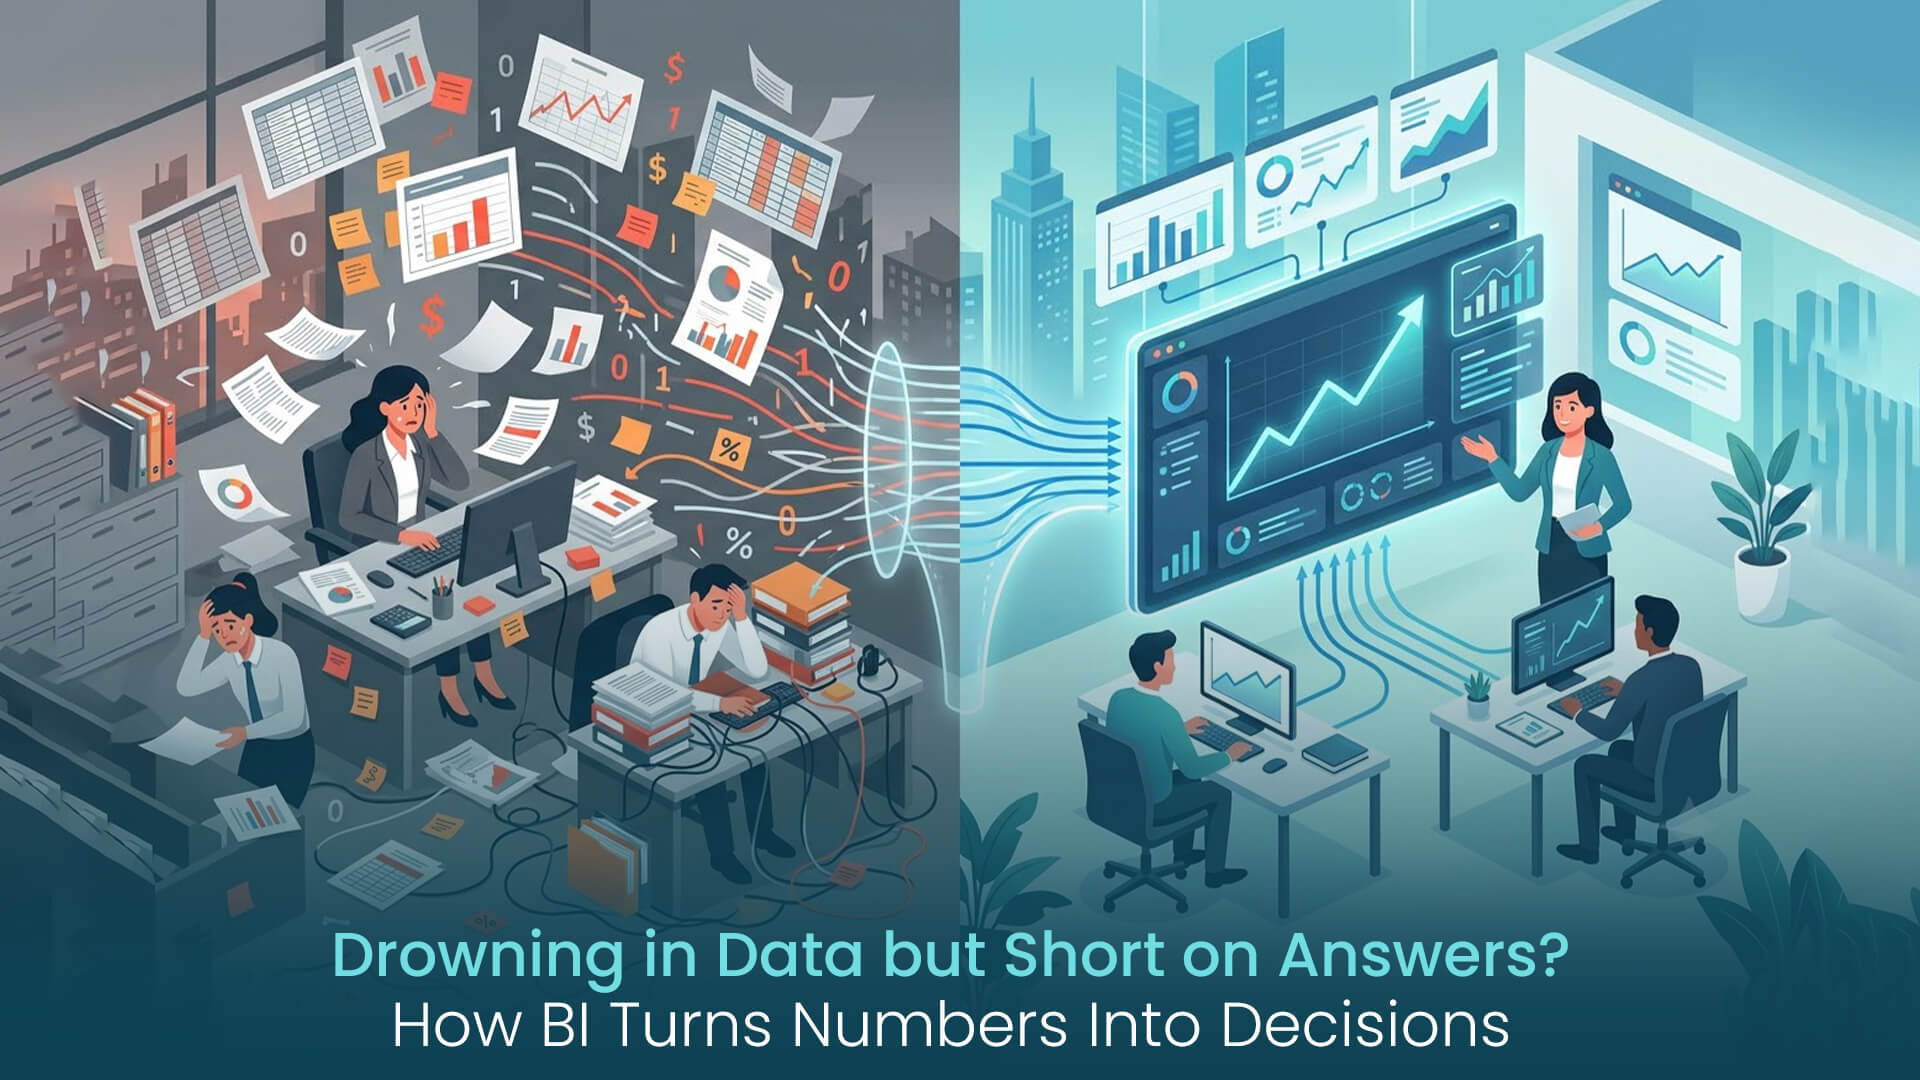
Look at the spot most businesses are stuck in. They've never had more data. Sales systems, finance software, ops tools, customer records, spreadsheets everywhere you look. It piles up every week. And then someone asks one straight question, and getting an answer still takes days, and it ends in a squabble over whose numbers are right.
It was never about having too little data. The data's just everywhere at once. It doesn't agree with itself, and it's locked inside systems that were never meant to talk. So somebody goes hunting, copies bits into a spreadsheet, patches the numbers that won't line up, and builds a report. By the time it's done, the decision has usually moved on, and half the room doesn't trust the figures anyway.
That's the gap BI is there to close. It does the gathering, the cleaning, the connecting once, and does it properly. After that, an answer is a click, not a week-long project. And fair warning: the clever bit isn't the dashboard. It's the dull, fiddly work happening underneath.
Six steps carry you from scattered numbers to a decision you can actually stand behind.
Pulls All Your Data Into One Place — one source of truth. Sales in one system, finance in another, ops somewhere else, plus a dozen spreadsheets plugging the gaps. BI pulls the lot into one connected place.
Cleans and Connects the Numbers — trustworthy figures. Raw data is a mess — duplicates, gaps, labels that don't match. BI cleans that up and joins it together, so the numbers finally agree.
Shows You the Story Visually — see the story. A wall of numbers hides what it means. The right chart hands it over in a second.
Answers Questions on Demand — self-serve. BI lets people go digging themselves, click into a number, filter by region or month, chase the question wherever it leads.
Surfaces Trends and Outliers — spot it early. BI turns up trends and outliers on its own, while there's still time to act.
Turns Insight Into Action — decide, don't guess. When the numbers are trustworthy, current and clear, decisions that used to run on gut feel start running on evidence.

Illustrative view of how BI turns scattered numbers into one connected, decision-ready picture.
The left-hand column is what daily life looks like without BI. The right is what shifts once your data is finally connected and something you can actually trust.
| Drowning in Data | What BI Changes |
|---|---|
| Data lives in many disconnected systems | One place that pulls it all together automatically |
| Numbers don't match between reports | Cleaned, connected, consistent figures you can trust |
| Reports take days to compile by hand | Live dashboards, ready whenever you need them |
| You react to problems only after the fact | Trends and outliers flagged early, while you can act |
| Decisions rest on gut feel, not evidence | Decisions backed by clear, current numbers |
| Only analysts can pull the answers | Anyone can ask and see for themselves, self-serve |
| You have plenty of data but little insight | Data turned into a story you can actually act on |
| By the time you see it, the data is stale | Current data, refreshed and ready on demand |
A dashboard is only ever as good as what's feeding it. Three things really decide whether BI ends up earning your trust or not.
At Swaran Soft, we build BI from the ground up. We connect your systems first, then clean and model the data underneath, and only then design dashboards your team can actually use on their own, without an analyst sitting beside them.
A quick look at how the different ways of getting answers out of your data stack up on the things that actually matter when you're making a real decision.
| Aspect | Spreadsheets | Static Reports | Modern BI | What You Gain |
|---|---|---|---|---|
| Single source of truth | No, versions everywhere | Partial, per report | Yes, one connected source | Numbers finally agree |
| Data freshness | Stale once saved | Accurate for a moment | Live, refreshed automatically | Act on current data |
| Who can get answers | Whoever built the file | Request and wait | Anyone, self-serve | No bottleneck |
| Spotting trends | By luck | If someone builds it | Surfaced automatically | Catch it early |
| Time to an answer | Hours of assembly | Days | Seconds to minutes | Decide sooner |
| Error risk | High, manual formulas | Moderate | Low, automated & verified | Trust the figures |
| Best suited for | Small, simple, one-off | Fixed periodic summaries | Ongoing, evolving decisions | Match to the need |
Rough figures for a BI setup built on a solid foundation. Your own numbers will depend on your data and the decisions you're making.
Wants to run the business on evidence, not on instinct and reports that are already stale.
Pain: Decisions rest on numbers that turn up late, don't agree with each other, or never explain the 'why'.
Outcome: A live, trustworthy picture of the whole business, so every big decision starts from evidence.
Buried every month in the grind of pulling reports together from a dozen scattered sources.
Pain: Days vanish into compiling and reconciling figures that won't match, leaving barely any time to think about what they mean.
Outcome: Reports that more or less build themselves from one clean source, freeing the team to interpret instead of assemble.
Needs answers about their own patch, but keeps having to queue behind an overworked analyst.
Pain: Every question turns into a request and then a wait, so decisions either drag or get made blind.
Outcome: Self-serve dashboards they can query themselves, right away, without having to go through anyone.
"Everyone wants the dashboard. The dashboard is the easy part. The value is in the boring work underneath, getting your data to agree with itself, because a beautiful chart on bad data just helps you be wrong with confidence."
We map your data sources and scope a first dashboard that earns your team's trust — at no cost.
Find out how connected your data actually is, and where the first dashboard should be.

AI Architect and Entrepreneur building India's Edge AI ecosystem. 25+ years in enterprise technology. Founder of Swaran Soft, Gignaati, and Copilots.in.